Elevated solar wind speeds of 420 to 430 km/s were measured by the WIND
satellite. During the time of the event, the ![]() component of the IMF
changed from a negative to positive from value while
component of the IMF
changed from a negative to positive from value while ![]() remained
positive and
remained
positive and ![]() small. No data was recorded from IMP8.
The
small. No data was recorded from IMP8.
The ![]() index at the time of the event was 1.0.
index at the time of the event was 1.0.
The overview map in Figure 5.46 shows extended backscatter and some
double-peaked spectra scattered at low and high latitudes. There appear to
be two bands of double-peaked spectra. An area of missing backscatter is
centered around ![]() E and
E and ![]() N.
N.
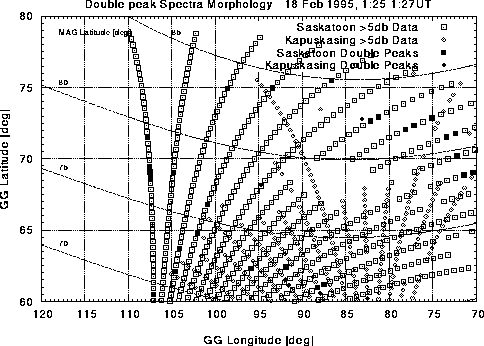
Figure 5.46: Map of spectral findings from the Saskatoon and Kapuskasing radars:
18 Feb/95
Figure 5.47 shows a flight path that takes the satellite
through the region of missing scatter ![]() to
to ![]() .
At
.
At ![]() the satellite is located at
the satellite is located at ![]() N latitude where the
Saskatoon radar observed double-peaked spectra along 3 beams.
N latitude where the
Saskatoon radar observed double-peaked spectra along 3 beams.
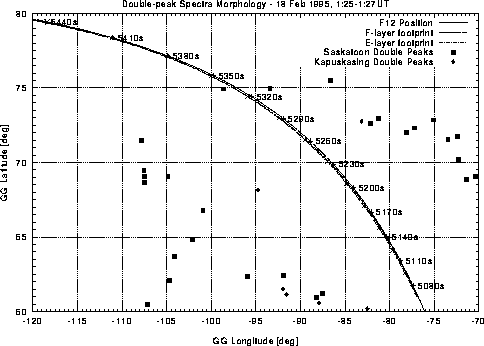
Figure 5.47: Peak-map with overlaid flight path of the DMSP F12 satellite: 18
Feb/95
The energy and flux data presented in Figure 5.48 show a low flux after
![]() and only three low energy precipitation events at
and only three low energy precipitation events at ![]() , 5135
s and
, 5135
s and ![]() . The low energy precipitation apparently produces no
corresponding double-peaked spectra observations from the radar.
. The low energy precipitation apparently produces no
corresponding double-peaked spectra observations from the radar.
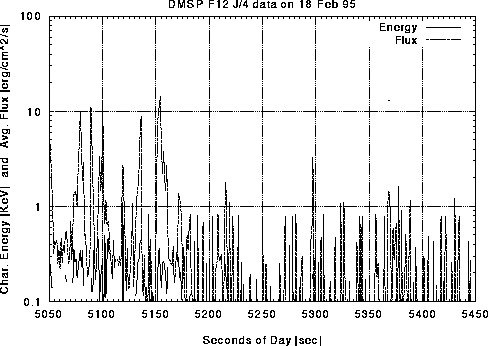
Figure 5.48: Average electron energy and flux determined from SSJ/4 instrument
measurements: 18 Feb/95
The ionization rates in Figure 5.49 reflect the low energy precipitation
events and also show some ionization at F-layer heights at ![]() when the
satellite is about at
when the
satellite is about at ![]() N latitude. The E-layer is quiet, which
can also be seen from the low conductivities in
Figure 5.50.
N latitude. The E-layer is quiet, which
can also be seen from the low conductivities in
Figure 5.50.
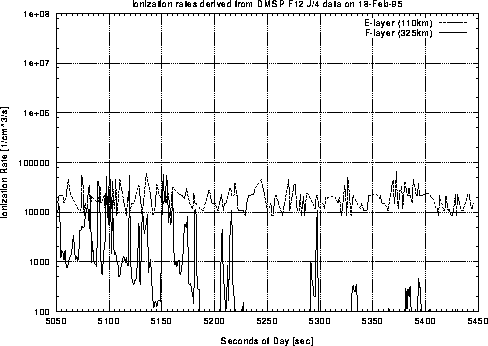
Figure 5.49: Estimated ionization rates at E- and F-layer heights determined from electron
spectra measurements: 18 Feb/95
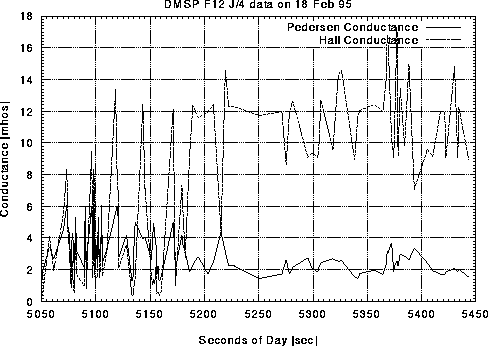
Figure 5.50: Estimated E-layer conductivities from the Robinson model: 18 Feb/95
The velocity map in Figure 5.51 shows only a small patch of flow vectors. This is due to the fact that there was a significant amount of groundscatter, and the processing of radar data into ionospheric velocity maps involves removing groundscatter points.
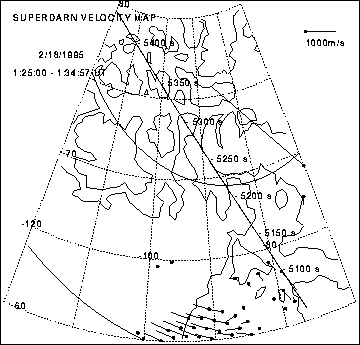
Figure 5.51: SuperDARN velocity map: 18 Feb/95