During the periods listed in Table 5.1 a special mode was running on the
Saskatoon radar to determine ACFs with a large number of lags. The lag
time unit was set at ![]() while the number of pulses was increased
from the normal number of 7 to 9 pulses. This special
operating mode requires an increase in the integration time from 2 minutes
to 4 minutes; however, both the short and the long integration times were implemented
to determine their effects on the ACF. As expected, the noise level in the ACFs
that were
integrated only for 2 minutes was much higher, so the analysis that follows
uses only the ACFs that were averaged for 4 minutes.
The resulting ACFs were used for accurate spectral estimation
with the FFT-based methods and are used to benchmark the different
parametric spectral estimators. Table 5.3 lists the periods when sufficient
backscatter was present to analyze the high-resolution ACFs.
while the number of pulses was increased
from the normal number of 7 to 9 pulses. This special
operating mode requires an increase in the integration time from 2 minutes
to 4 minutes; however, both the short and the long integration times were implemented
to determine their effects on the ACF. As expected, the noise level in the ACFs
that were
integrated only for 2 minutes was much higher, so the analysis that follows
uses only the ACFs that were averaged for 4 minutes.
The resulting ACFs were used for accurate spectral estimation
with the FFT-based methods and are used to benchmark the different
parametric spectral estimators. Table 5.3 lists the periods when sufficient
backscatter was present to analyze the high-resolution ACFs.
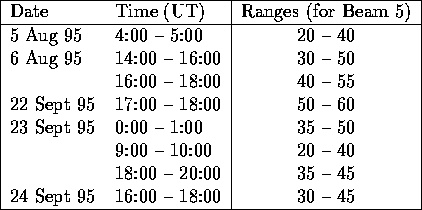
Table 5.3: Periods with sufficient backscatter intensity during 9-pulse mode
on the Saskatoon SuperDARN radar
Figure 5.2 shows the ACFs for a patch of radar backscatter that were recorded between 18:28:28 and 18:29:11 UT on Sept 23, 1995. Figure 5.1 shows a single enlarged graph of this set to which the reader can refer so as to read more clearly the axis labels and titles. The columns correspond to the beams 2 to 5 (right to left) and the rows to ranges 37 to 42 (top to bottom) respectively. The ACFs have not been smoothed; missing values in the ACFs have been interpolated linearly from adjacent points. One can identify a definite response of the ACF even at lags of 20 and more. This slow decay of the ACF power indicates a narrow width in the corresponding power spectrum, i.e. slow decorrelation. In some ACFs , a response that resembles a ``beating pattern'' between two sinusoids can be seen (beam 2 range 39, beam 3 range 40, beam 4 ranges 39 and 40).
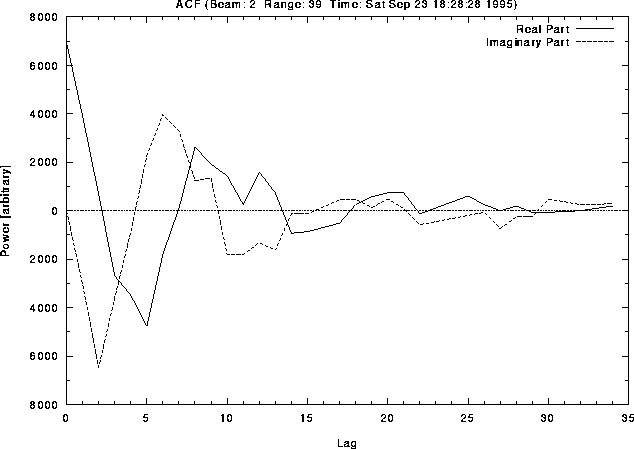
Figure 5.1: High-resolution autocovariance function for a
single beam/range cell
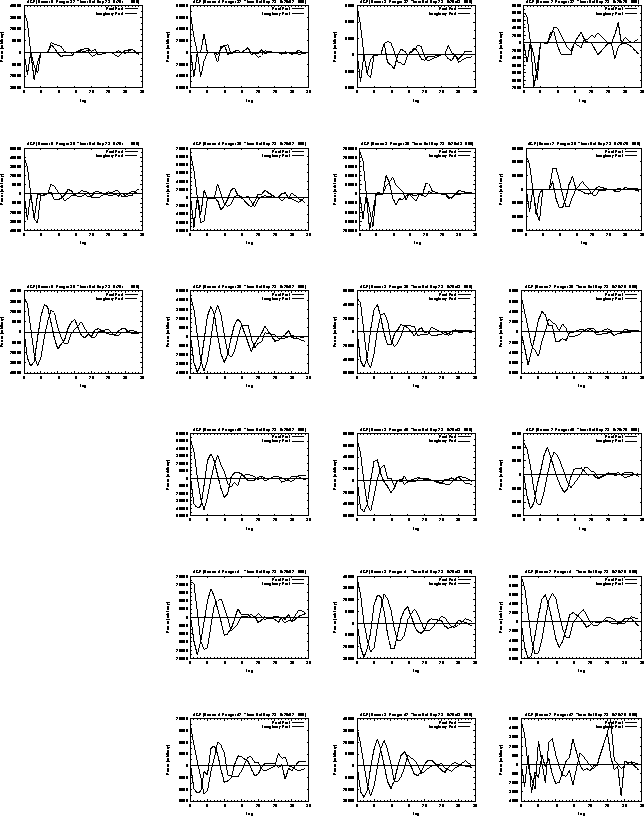
Figure 5.2: High-resolution autocovariance functions for a section of
SuperDARN data. The four columns represent beams 5 to 2 and the six rows
represent ranges 37 to 42, for lags 0 to 35, in units of 2.4 ms.
Figure 5.4 shows the Doppler-power spectral density (PSD) estimates based on a periodogram method using 32-sample FFTs and a ``window shift'' of 16 lags. Again, Figure 5.3 shows a single graph of this set for reference. In most PSD plots a single, dominant peak appears. Some PSD plots show also smaller peaks of low intensity at high velocities. These are mostly due to sidelobes created by the FFT method and usually correspond to noisy ACFs or ACFs with some missing points. In general, without an aperture window applied (i.e. when using a rectangular window), as is the case for the FFT based periodogram used here, sidelobes of relatively high magnitude are to be expected for single peaks [Mar87, pp. 137-144,]. Although the frequency resolution of the periodogram is not very high, a double peaked spectral feature can be identified at beam 3, range 40.
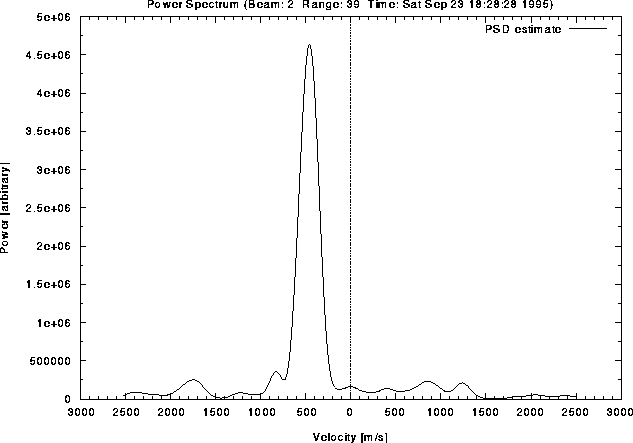
Figure: 32-point-FFT based spectral estimate with a window shift of 16
samples of the previous single ACF
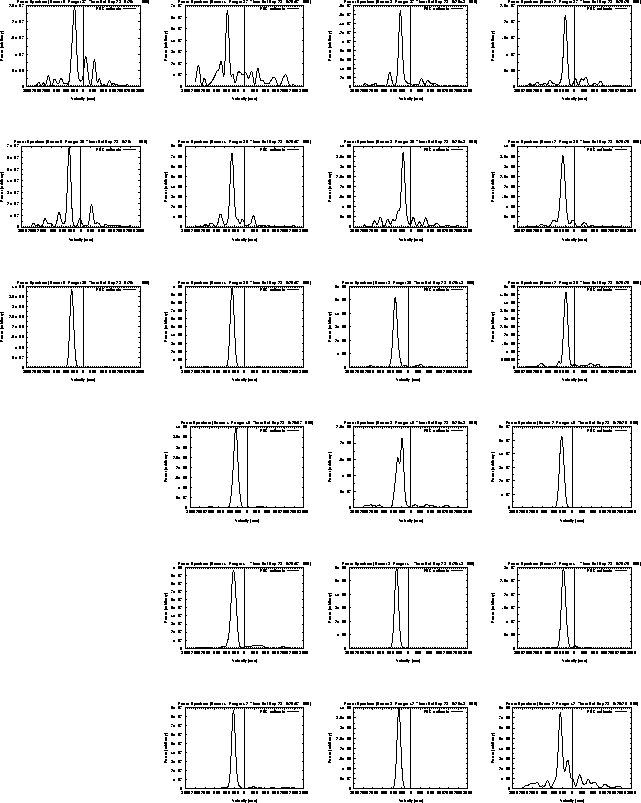
Figure: 32-point-FFT based spectral estimate with a window shift of 16
samples of the previous set of ACFs. Columns are beams 5 to 2 (left to
right) and rows are ranges 37 to 42 (top to bottom).
Figure 5.6 shows PSD estimates calculated using a parametric model: the Burg model of order 8. The Burg algorithm was choosen since it is fast and has a better resolution than the Yule-Walker algorithm. Eigenvalue based methods such as the MUSIC algorithm did not converge to a solution reliably. These were therefore not considered for the analysis. A single graph of this set is shown in Figure 5.5. The analysis of the same ACFs with different model orders has shown that an order of 6 or less is not sufficient to resolve the double peaked feature at beam 3, range 40. Conversely, an order of 16 or higher does not change the resulting PSD estimates much, except that the noise components become more frequent and sharper and the double peaked feature splits into three peaks. This behavior is expected from this model and, as mentioned earlier, the model order has to be chosen as low as possible - in this case an order of 8 seems appropriate. There are now several PSD plots with a distinct split-peak response that was not resolved by the periodogram method. An interesting observation is that the features appear to be located in a confined area of ranges 39 and 40 for all beams. The peak separation is variable and the largest separation occurs at beam 3, range 40.
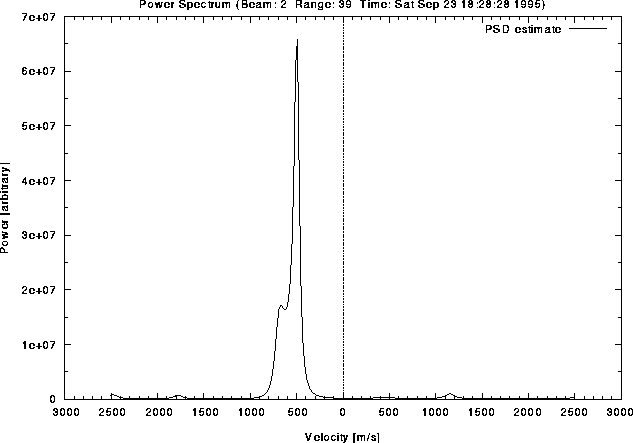
Figure 5.5: Spectral estimate based on the Burg method of order 8
of the previous single ACF
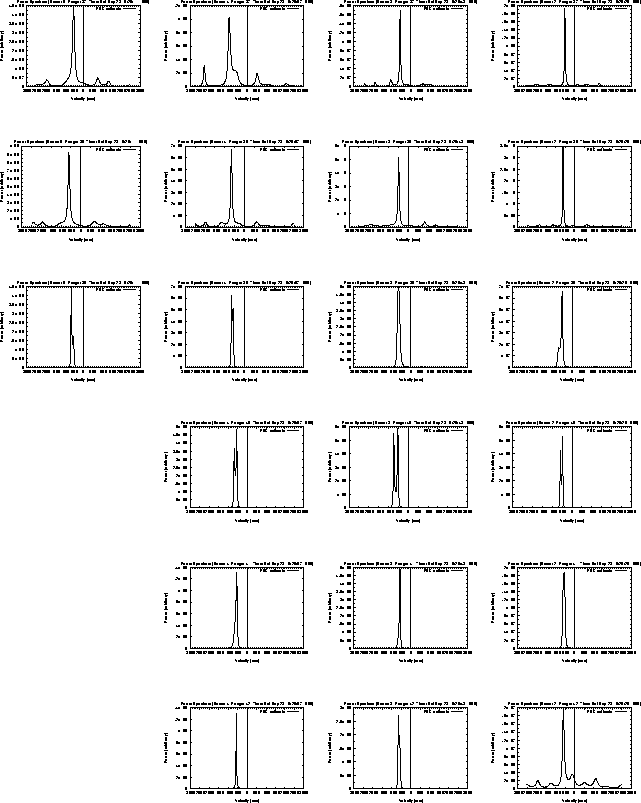
Figure 5.6: Spectral estimate based on the Burg method of order 8 of the
previous ACFs. Columns are beams 5 to 2 (left to
right) and rows are ranges 37 to 42 (top to bottom).
Given the identification of this special spectral feature - a Doppler-velocity power spectrum with two close, narrow peaks - from the high-resolution ACFs using a parametric model, it is assumed that further analysis of SuperDARN data can make use of the same procedure to determine the morphology and cause of this effect.