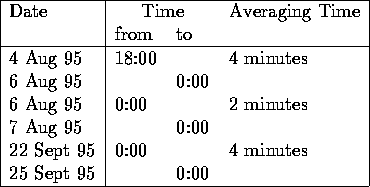
Table 5.1 shows times during which a 9-pulse scanning mode
was used on the Saskatoon SuperDARN radar. The sequence used is one of the
9 pulse patterns
listed in Table 3.3. Pulses are located
at 0 ![]() , 3
, 3 ![]() , 4
, 4 ![]() , 14
, 14 ![]() ,
22
,
22 ![]() , 29
, 29 ![]() , 31
, 31 ![]() , 34
, 34 ![]() and 35
and 35 ![]() , where
, where ![]() was
was
![]() as the basic lag separation.
as the basic lag separation.

Table 5.1: Periods of 9-pulse high-resolution ACF scanning mode on the Saskatoon
Radar
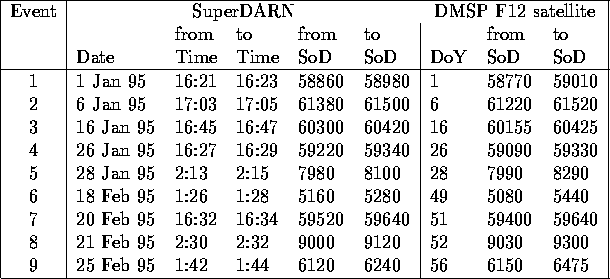
Table 5.2 lists the observational periods that were used to compare
SuperDARN data and measurements of the SSJ/4 particle analyzer on board of
the DMSP F12 satellite .
.

Table 5.2: Observational periods for SuperDARN radars in Saskatoon and
Kapuskasing and DMSP F12 satellite for comparisons