The Dual Auroral Radar Network (DARN) is a global-scale network of HF and
VHF radars capable of sensing backscatter from ionospheric irregularities in
the E- and F-regions of the high latitude ionosphere. The current network of
radars was given the acronym SuperDARN since it was derived from the DARN
concept but is significantly larger in scope. The HF radars are based upon
the design of the Goose Bay HF radar system described by Greenwald et al.
[GBHH85]. A good general discussion about SuperDARN can
be found in the paper by Greenwald et al. [GBD ![]() 95].
95].
The radars use ionospheric refraction to achieve orthogonality with the
magnetic field since a key factor is magnetic aspect sensitivity.
To adjust for the effects on refraction of changes in the electron density,
the radar
is capable of operating over an extended frequency range from 8 to 20 MHz.
The main antenna array consists of 16 log-periodic antennas which are fed by
electronically phased signals that allow for beam-forming and beam-steering
over a ![]() azimuthal range. Only a single beam is produced at any given
time. The half-power beamwidth depends on the
frequency and ranges from
azimuthal range. Only a single beam is produced at any given
time. The half-power beamwidth depends on the
frequency and ranges from ![]() at 20 MHz to
at 20 MHz to ![]() at 8 MHz. The range
resolution
at 8 MHz. The range
resolution ![]() of the SuperDARN measurements is determined by the transmitted
pulse length. It is typically
of the SuperDARN measurements is determined by the transmitted
pulse length. It is typically ![]() (so
(so ![]() is normally
is normally ![]() ). However pulses as short as
). However pulses as short as ![]() can be used for a range resolution of
can be used for a range resolution of
![]() . Since the radar
beam can be steered, a rapid scanning through a number of beam directions is
possible.
. Since the radar
beam can be steered, a rapid scanning through a number of beam directions is
possible.
The radar uses a multipulse transmission sequence consisting of 5
to 9 pulses. The backscatter signals returned from these pulses are sampled and
are processed to generate the complex autocovariance
function (ACF) as a function of time delay between pulses for all ranges.
The multipulse sequence is repeated about 60 times for a given beam
position, so the 60 ACFs can be integrated and averaged to increase the
signal to noise ratio. These ACFs can then be used to
determine a Doppler power spectrum for each range. The ACFs can also be used
to determine the backscattered power, mean Doppler velocity and spectral width.
Data from a radar pair with overlapping fields of view can be used to
determine convection maps of the F-layer plasma from the individual Doppler
velocities. Because of the large field-of-view for each radar pair,
SuperDARN data are ideal for analysis in combination with data obtained by other
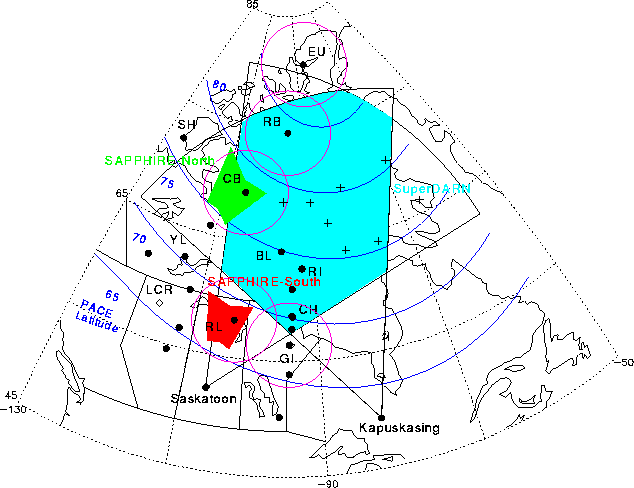
instruments. Figure 3.2 shows a map with the field of view of a SuperDARN
radar pair and the locations of other instruments.


Figure 3.2: The field of view of the Saskatoon and Kapuskasing SuperDARN
radar pair, Sapphire VHF radars, all-sky imagers and magnetometer sites (EU
- Eureka, RB - Resolute Bay, SH - Sachs Harbor, CB - Cambridge Bay, YL -
Yellowknife, BL - Baker Lake, RI - Rankin Inlet, LCR - LaCrete, RL - Rabbit
Lake, CH - Churchill, GI - Gillam).
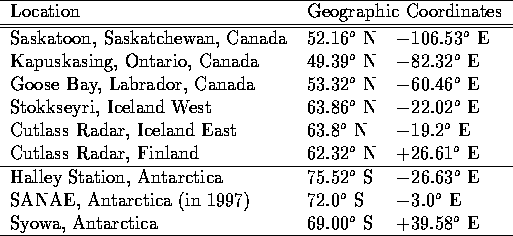
The combination of several radar pairs can be used to draw a global picture of the convection. Conjugate studies are possible due to the existence of radars in the northern and southern hemisphere. Table 3.1 lists all SuperDARN radars that are operational (or will be in the near future). The first six radars constitute the three northern hemisphere pairs, the last three will act as a triplet in Antarctica.

Table 3.1: Geographic locations of SuperDARN sites
One of the main data processing steps with SuperDARN data is the
merging of
data sets from two different radars with an overlapping field of view into a
vector velocity map [RGB ![]() 89]. This is done on a grid of 16 by
16 cells and will yield
actual plasma speeds at these locations [SC94]. From such velocity
maps, one also can derive maps of field-aligned currents. One can show that
the vorticity (the curl of the plasma convection velocity) is a direct measure
of the ``magnetospheric'' component
89]. This is done on a grid of 16 by
16 cells and will yield
actual plasma speeds at these locations [SC94]. From such velocity
maps, one also can derive maps of field-aligned currents. One can show that
the vorticity (the curl of the plasma convection velocity) is a direct measure
of the ``magnetospheric'' component ![]() of the field-aligned current:
of the field-aligned current:
![]()
where ![]() is the height integrated Pedersen conductivity and
is the height integrated Pedersen conductivity and
![]() the
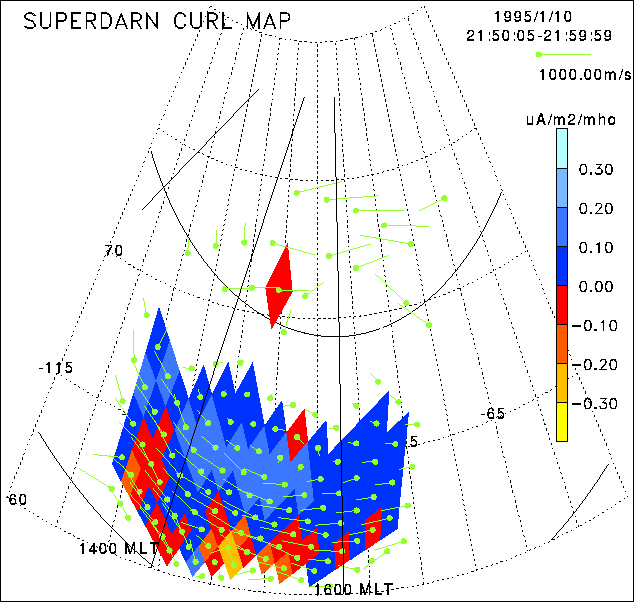
magnetic field [SGB95]. Figure 3.3 is an example of such an
analysis, showing both the 2D convection map and the resulting field aligned
current system that has been calculated.
the
magnetic field [SGB95]. Figure 3.3 is an example of such an
analysis, showing both the 2D convection map and the resulting field aligned
current system that has been calculated.

Figure 3.3: SuperDARN curl plot showing the large-scale distribution of the
plasma convection velocity and the magnetospheric field
aligned current component