During the event, WIND measured a solar plasma speed of around 600
km/s. The IMF conditions were such that the ![]() component shifted from
negative to positive around 16:00 UT while the
component shifted from
negative to positive around 16:00 UT while the ![]() component
remained positive throughout the period. IMP8 data were not available.
The
component
remained positive throughout the period. IMP8 data were not available.
The ![]() index at the time of the event was 2.5.
index at the time of the event was 2.5.
In the overview of Figure 5.22 a large section of the backscatter region shows
double-peaked spectral features. Both radars observe the features in
approximately the same region, although the Saskatoon radar finds more of them.
Distinguishable is also a segmentation into two bands of double-peaked
spectral events with single peaked spectra between these regions along
a line from ![]() E and
E and ![]() N to
N to ![]() E and
E and ![]() N.
Also visible is a patch of missing radar scatter, centered around
N.
Also visible is a patch of missing radar scatter, centered around ![]() E
and
E
and ![]() N. This region is very much larger for the
Kapuskasing radar than for the Saskatoon radar, indicating that either the
scattering conditions or the propagation conditions were less favourable
for the Kapuskasing radar.
N. This region is very much larger for the
Kapuskasing radar than for the Saskatoon radar, indicating that either the
scattering conditions or the propagation conditions were less favourable
for the Kapuskasing radar.
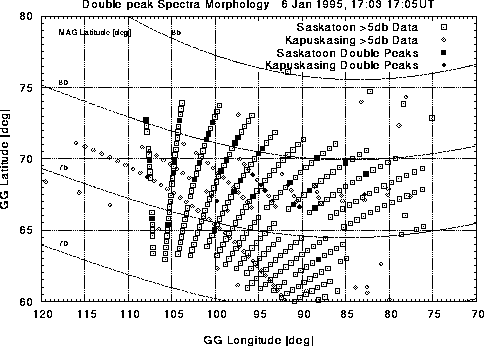
Figure 5.22: Map of spectral findings from the Saskatoon and Kapuskasing radars:
6 Jan/95
The satellite flight path goes first through the regions with double-peaked
spectra from ![]() -
- ![]() and from
and from ![]() -
- ![]() , skims
the area of
missing backscatter around
, skims
the area of
missing backscatter around ![]() and then enters a zone of normal
backscatter and spectra (see Figure 5.22 and
5.23).
and then enters a zone of normal
backscatter and spectra (see Figure 5.22 and
5.23).
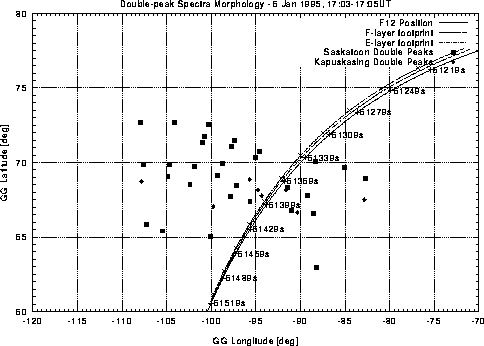
Figure 5.23: Peak-map with overlaid flight path of the DMSP F12 satellite: 6
Jan/95
Figure 5.24 shows a zone of variable flux at low energies
from ![]() to
to
![]() followed by a zone of steady flux with high electron energies
of
followed by a zone of steady flux with high electron energies
of ![]() (after
(after ![]() ). Interesting is a peak of almost
). Interesting is a peak of almost ![]() in the
characteristic energy at
in the
characteristic energy at ![]() with a severe dropout in the flux. This is in a region of several maxima in the
flux and highlights the highly variable flux conditions in this segment.
with a severe dropout in the flux. This is in a region of several maxima in the
flux and highlights the highly variable flux conditions in this segment.
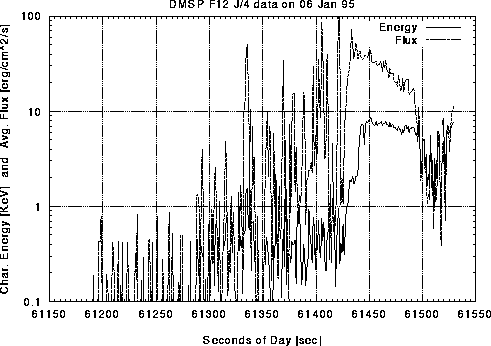
Figure 5.24: Average electron energy and flux determined from SSJ/4 instrument
measurements: 6 Jan/95
The ionization rates in Figure 5.25 match the spectral findings and the
low-energy and high-flux regions. A region of increased F-layer ionization can be
identified from about ![]() to
to ![]() and from
and from ![]() to
to ![]() , which corresponds to the regions of low energy precipitation and
double-peaked spectra. The ionization is very variable, and the flux peaks
are short in duration, often only 5 -
, which corresponds to the regions of low energy precipitation and
double-peaked spectra. The ionization is very variable, and the flux peaks
are short in duration, often only 5 - ![]() , which corresponds to
spatial structures only about 35 -
, which corresponds to
spatial structures only about 35 - ![]() in width or diameter. The
results suggest a spatially inhomogeneous region populated with columns
which are like large-scale auroral rays, except that the columns are
associated with large fluxes of less than 1 keV electrons. It is
conceivable that these structures can produce the banded regions
described earlier. At
in width or diameter. The
results suggest a spatially inhomogeneous region populated with columns
which are like large-scale auroral rays, except that the columns are
associated with large fluxes of less than 1 keV electrons. It is
conceivable that these structures can produce the banded regions
described earlier. At ![]() and later one can observe a region of
high E-layer ionization.
and later one can observe a region of
high E-layer ionization.
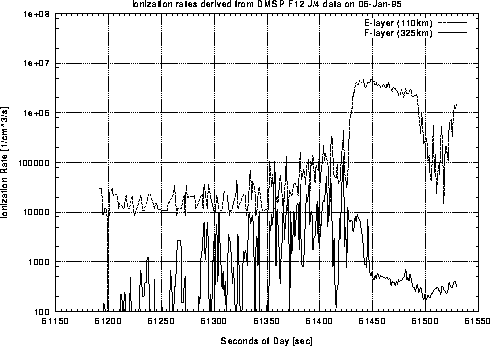
Figure 5.25: Estimated ionization rates at E- and F-layer heights determined from electron
spectra measurements: 6 Jan/95
The region of E-layer ionization shows up very well in
Figure 5.26 in the
E-layer conductivities. Remarkable though is a peak at ![]() of
40 mhos coinciding exactly with the location of the beginning of missing
backscatter; the gradient reaches here a magnitude of
of
40 mhos coinciding exactly with the location of the beginning of missing
backscatter; the gradient reaches here a magnitude of ![]() over a very short spatial region of only about
over a very short spatial region of only about ![]() along the
satellite track, which is the distance traversed in about
along the
satellite track, which is the distance traversed in about ![]() .
.
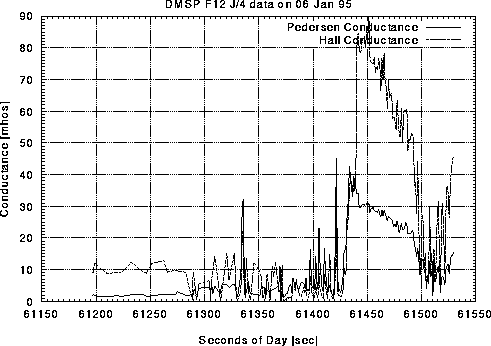
Figure 5.26: Estimated E-layer conductivities from the Robinson model: 6 Jan/95
As can be seen in Figure 5.27, double-peaked spectra occur in a region of
steady northward flow at velocities ranging from ![]() to
to ![]() .
.
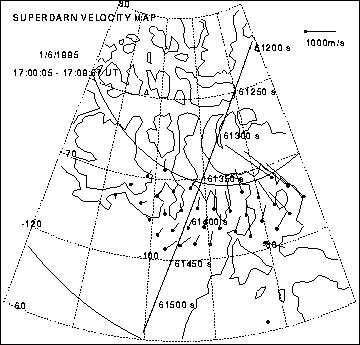
Figure 5.27: SuperDARN velocity map: 6 Jan/95