Shortly before the event the solar wind speed dropped from a maximum of 380
km/s to a steady value of ![]() throughout the event. IMF conditions
remained constant before and during the event with
throughout the event. IMF conditions
remained constant before and during the event with ![]() and
and ![]() positive and
positive and ![]() negative and magnitudes below
negative and magnitudes below ![]() . IMP8 was situated
within the magnetosphere.
The
. IMP8 was situated
within the magnetosphere.
The ![]() index at the time of the event was 4.0 (disturbed).
index at the time of the event was 4.0 (disturbed).
The overview in Figure 5.28 shows a localized region
of double-peaked spectra
from ![]() N to
N to ![]() N except for a gap of some
N except for a gap of some ![]() in longitude
from
in longitude
from ![]() E to
E to ![]() E.
Even when the rules are relaxed to allow for peaks with
a separation of up to
E.
Even when the rules are relaxed to allow for peaks with
a separation of up to ![]() , no more events are found in this region.
, no more events are found in this region.
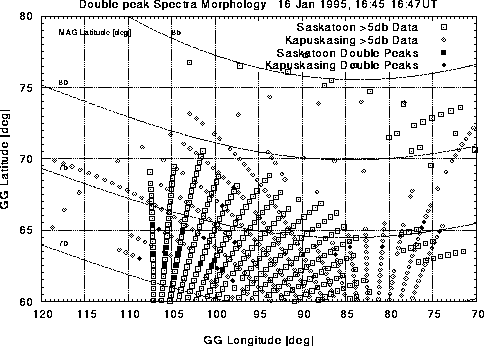
Figure 5.28: Map of spectral findings from the Saskatoon and Kapuskasing radars:
16 Jan/95
As can be seen in Figure 5.29, the satellite passes through
the longitudinal gap in the region of double-peaked spectra.
From ![]() to
to ![]() , the satellite traverses the latitude range
where double-peaked spectra occur to the east and west of the trajectory.
, the satellite traverses the latitude range
where double-peaked spectra occur to the east and west of the trajectory.
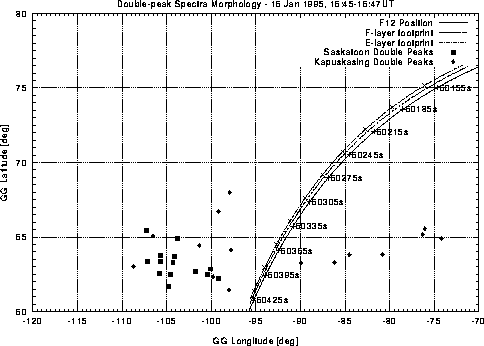
Figure 5.29: Peak-map with overlaid flight path of the DMSP F12 satellite: 16
Jan/95
Figure 5.30 shows that there was a very small flux during
most of the satellite track segment, except after ![]() .
The average energy is first low and after
.
The average energy is first low and after ![]() rises to about
rises to about ![]() .
.
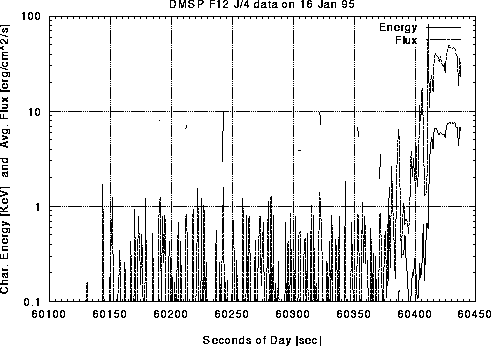
Figure 5.30: Average electron energy and flux determined from SSJ/4 instrument
measurements: 16 Jan/95
The ionization rate data shown in Figure 5.31 yield a more
revealing picture than the energy/flux data from the
previous figure. Observable is an increase in F-layer ionization by two
orders of magnitude from ![]() to
to ![]() ,
corresponding approximately to the latitudes where double-peaked
spectra are found et higher and lower longitudes. The high energy electron
precipitation after
,
corresponding approximately to the latitudes where double-peaked
spectra are found et higher and lower longitudes. The high energy electron
precipitation after ![]() is reflected in the increased E-layer ionization
rate and the E-layer conductivities that are presented in
Figure 5.32.
is reflected in the increased E-layer ionization
rate and the E-layer conductivities that are presented in
Figure 5.32.
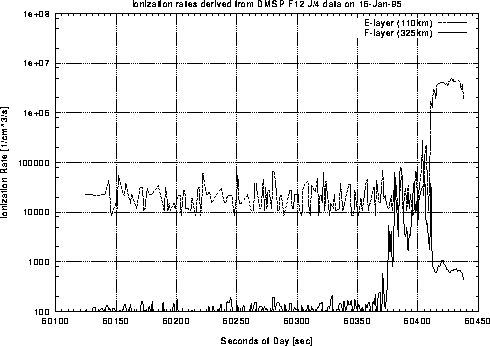
Figure 5.31: Estimated ionization rates at E- and F-layer heights determined from electron
spectra measurements: 16 Jan/95
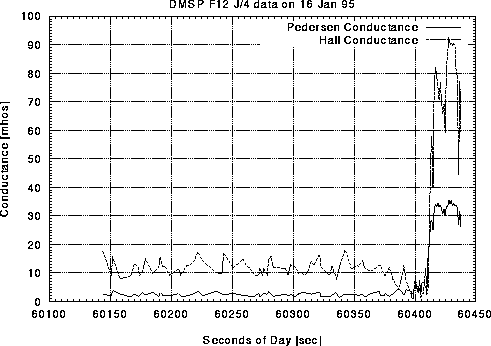
Figure 5.32: Estimated E-layer conductivities from the Robinson model: 16 Jan/95
The velocity map in Figure 5.33 shows relatively high velocities and two
segments of flow in opposite directions, the dividing line along
![]() N latitude, which is
approximately the position of double-peaked spectra.
Also notable is a region of low, randomly-directed velocities
around
N latitude, which is
approximately the position of double-peaked spectra.
Also notable is a region of low, randomly-directed velocities
around ![]() E and
E and ![]() N. This is also the location
of an accumulation of double-peaked spectra observations.
N. This is also the location
of an accumulation of double-peaked spectra observations.
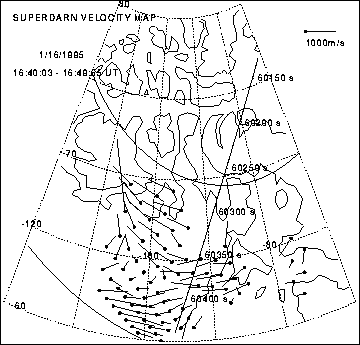
Figure 5.33: SuperDARN velocity map: 16 Jan/95