Partial WIND data shows solar plasma speeds around 310 km/s and undisturbed
IMF values close to zero. IMP8 shows a sign change in the ![]() component
from positive to negative about 30 minutes before the event.
The
component
from positive to negative about 30 minutes before the event.
The ![]() index at the time of the event was 1.0.
index at the time of the event was 1.0.
Little backscatter from both radars was observed during this event as can be seen in Figure 5.40; most notably there exists no overlap between the Saskatoon and Kapuskasing scatter in the regions where backscatter was observed.
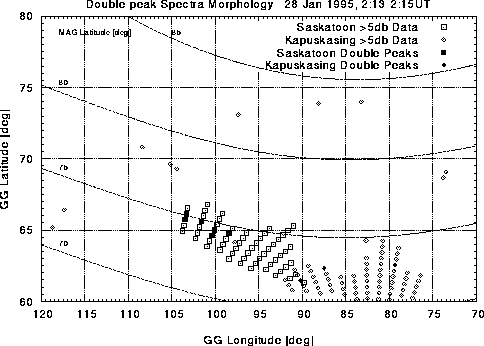
Figure 5.40: Map of spectral findings from the Saskatoon and Kapuskasing radars:
28 Jan/95
From Figure 5.41 one can see that the satellite flight path
passed briefly through a region where Kapuskasing backscatter was observed.
At about ![]() it passed through a region where double-peaked spectra were
observed. No backscatter was observed in the region traversed by the
satellite after
it passed through a region where double-peaked spectra were
observed. No backscatter was observed in the region traversed by the
satellite after ![]() .
.
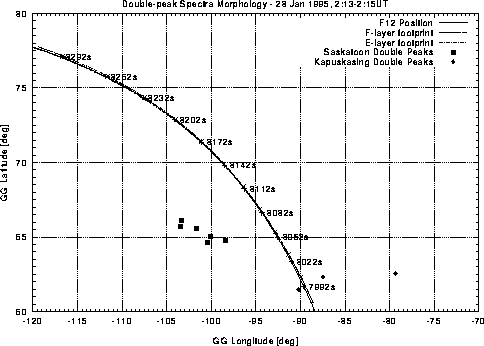
Figure 5.41: Peak-map with overlaid flight path of the DMSP F12 satellite: 28
Jan/95
The energy of the electrons when they can be detected (before ![]() )
is well below
)
is well below ![]() (see Figure 5.42).
(see Figure 5.42).
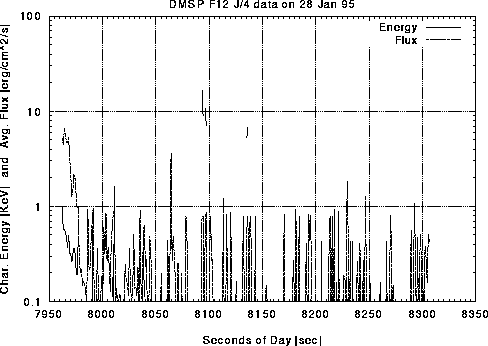
Figure 5.42: Average electron energy and flux determined from SSJ/4 instrument
measurements: 28 Jan/95
The ionization rate graph in Figure 5.43 shows two F-layer rate changes of
one order of magnitude at about 7980 and at ![]() ; the satellite
location corresponds well with the region where the
double peaks were observed. Also, the F-layer ionization rate shows
relatively high peaks until about
; the satellite
location corresponds well with the region where the
double peaks were observed. Also, the F-layer ionization rate shows
relatively high peaks until about ![]() . E-layer ionization and conductivities
are negligible. The graph in Figure 5.44 is mostly dominated
by a noisy response, in keeping with the very low electron fluxes.
. E-layer ionization and conductivities
are negligible. The graph in Figure 5.44 is mostly dominated
by a noisy response, in keeping with the very low electron fluxes.
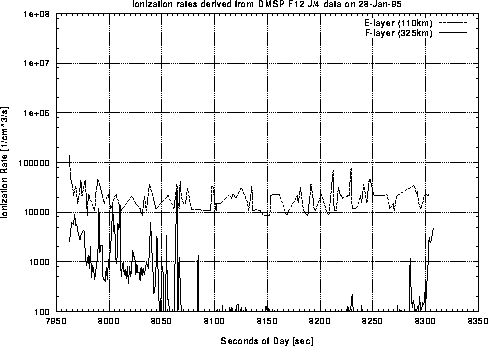
Figure 5.43: Estimated ionization rates at E- and F-layer heights determined from electron
spectra measurements: 28 Jan/95
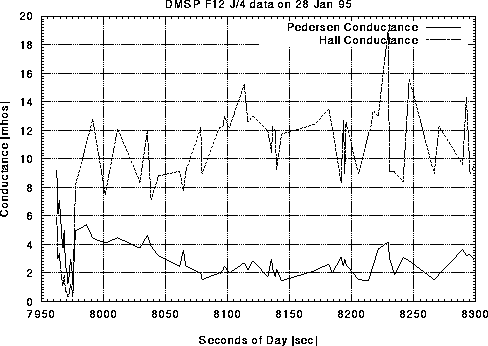
Figure 5.44: Estimated E-layer conductivities from the Robinson model: 28 Jan/95
The few points in the velocity map of Figure 5.45 show
different flow
directions west and east of the ![]() E line. The map contains too little
information for any further conclusions.
E line. The map contains too little
information for any further conclusions.
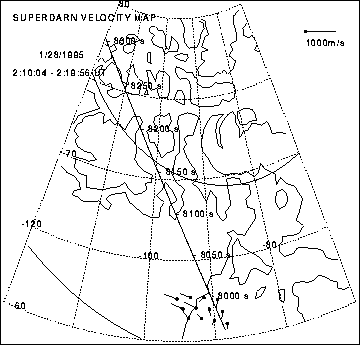
Figure 5.45: SuperDARN velocity map: 28 Jan/95