WIND measured a slight increase of the solar plasma speed from 310 to 320
km/s along with a change of ![]() and
and ![]() from zero to a small
positive value around the time the event was recorded. IMF conditions were
undisturbed otherwise. IMP8 IMF measurements compare well with the WIND
measurements.
The
from zero to a small
positive value around the time the event was recorded. IMF conditions were
undisturbed otherwise. IMP8 IMF measurements compare well with the WIND
measurements.
The ![]() index at the time of the event was 1.0.
index at the time of the event was 1.0.
Figure 5.34 shows that backscatter was observed by both
radars from an extended region. The
Kapuskasing radar, however, shows an echo gap from ![]() E to
E to ![]() E,
centered at a latitude around
E,
centered at a latitude around ![]() N. A patch of double-peaked spectra was
observed mostly by the Kapuskasing radar from
N. A patch of double-peaked spectra was
observed mostly by the Kapuskasing radar from ![]() E to
E to ![]() E
at a latitude around
E
at a latitude around ![]() N.
N.
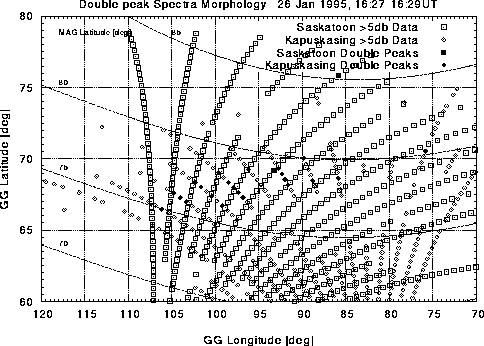
Figure 5.34: Map of spectral findings from the Saskatoon and Kapuskasing radars:
26 Jan/95
In Figure 5.35 the satellite track for this event is shown; one can identify
two regions. First, coming from the north, the satellite passes by the
double-peaked spectra region at about ![]() . It then enters the region
of missing backscatter from the Kapuskasing radar at
. It then enters the region
of missing backscatter from the Kapuskasing radar at ![]() and leaves
it again at
and leaves
it again at ![]() .
.
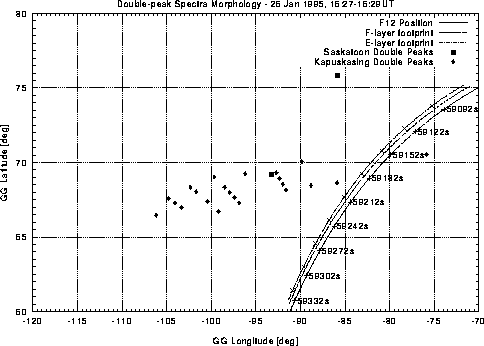
Figure 5.35: Peak-map with overlaid flight path of the DMSP F12 satellite: 26
Jan/95
The flux and energy data in Figure 5.36 also show two regions. From 59185
s to ![]() there is increased flux of
there is increased flux of ![]() electrons. Then, from 59235
s there is an increased flux of
electrons. Then, from 59235
s there is an increased flux of ![]() electrons until
electrons until ![]() , then of
, then of ![]() electrons until
electrons until ![]() , followed by electron energies of
, followed by electron energies of ![]() or
more - all relatively high electron energies.
or
more - all relatively high electron energies.
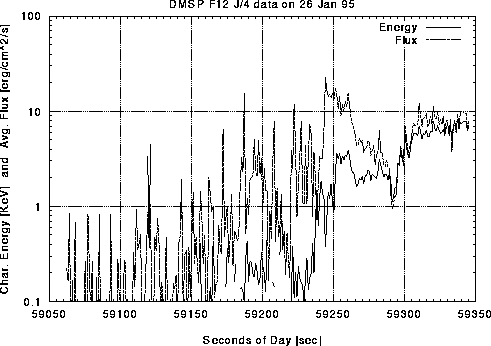
Figure 5.36: Average electron energy and flux determined from SSJ/4 instrument
measurements: 26 Jan/95
The ionization rates shown in Figure 5.37 compare well with the radar
observations in the fact that there exists a region of high F-layer
ionization which is centered around ![]() , the time when
double-peaked spectra were observed.
, the time when
double-peaked spectra were observed.
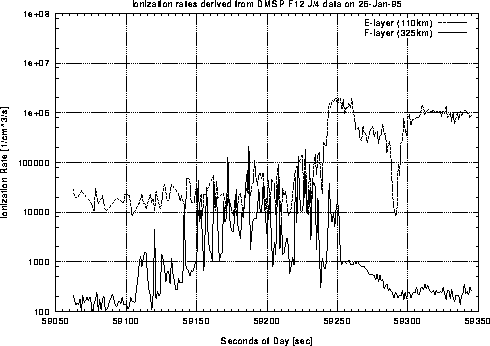
Figure 5.37: Estimated ionization rates at E- and F-layer heights determined from electron
spectra measurements: 26 Jan/95
Figure 5.38 shows the E-layer conductivities, which
are small, reflecting the low flux in the
precipitation pattern. A sharp gradient in the conductances is
observed at ![]() .
.
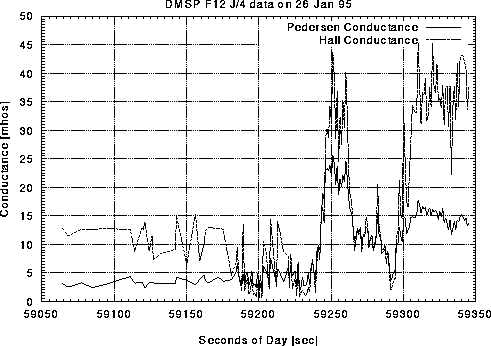
Figure 5.38: Estimated E-layer conductivities from the Robinson model: 26 Jan/95
As in the event on 16 Feb/95, Figure 5.39 shows a velocity map that is dominated by flow in opposite directions. The region of the convection reversal corresponds reasonably well to the location of the double peaked spectra.
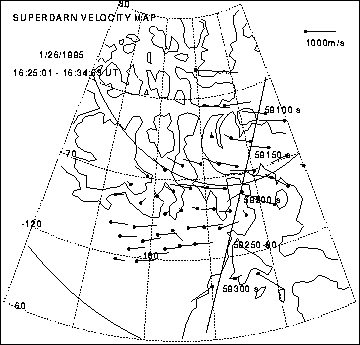
Figure 5.39: SuperDARN velocity map: 26 Jan/95