Solar plasma speeds as measured by WIND were very constant at 400 km/s
throughout the event. IMF parameters as measured by WIND indicate a positive
![]() and a
and a ![]() change from positive to zero during the event.
IMP8 recorded a sharp drop of the
change from positive to zero during the event.
IMP8 recorded a sharp drop of the ![]() and the
and the ![]() components
preceding and during the event while
components
preceding and during the event while ![]() remained positive and small.
The
remained positive and small.
The ![]() index at the time of the event was 2.0 and falling.
index at the time of the event was 2.0 and falling.
The overview in Figure 5.52 indicates good scattering conditions for both
radars. The Kapuskasing radar shows a region of missing backscatter around
![]() N from
N from ![]() E to
E to ![]() E. Both radars record double-peaked
spectra in a region centered at
E. Both radars record double-peaked
spectra in a region centered at ![]() N from about
N from about ![]() E to
E to
![]() E. The locations of these spectra from both radars compare well.
E. The locations of these spectra from both radars compare well.
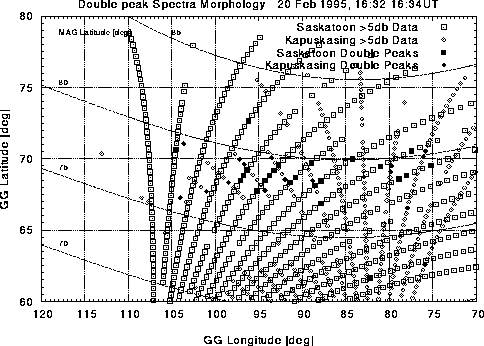
Figure 5.52: Map of spectral findings from the Saskatoon and Kapuskasing radars:
20 Feb/95
As can be seen in Figure 5.53, the satellite passes right
through the region where double-peaked spectra were found from ![]() to
to ![]() .
It also crosses over the region of missing Kapuskasing backscatter
from
.
It also crosses over the region of missing Kapuskasing backscatter
from ![]() to
to ![]() as can be seen in Figure 5.52.
as can be seen in Figure 5.52.
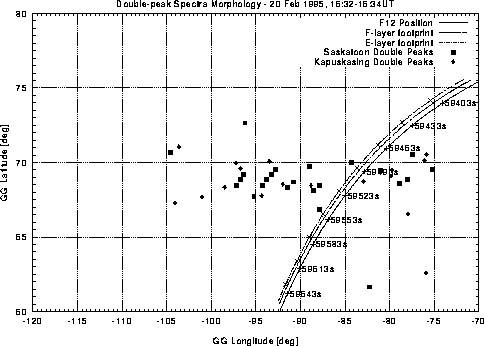
Figure 5.53: Peak-map with overlaid flight path of the DMSP F12 satellite: 20
Feb/95
Figure 5.54 shows relatively high fluxes during most of the track segment.
The electron energy is highest from ![]() to
to ![]() corresponding to
the region of missing backscatter. From
corresponding to
the region of missing backscatter. From ![]() to
to ![]() , which is the
interval in which double-peaked spectra were found, the satellite
recorded several high flux events at low electron energy.
, which is the
interval in which double-peaked spectra were found, the satellite
recorded several high flux events at low electron energy.
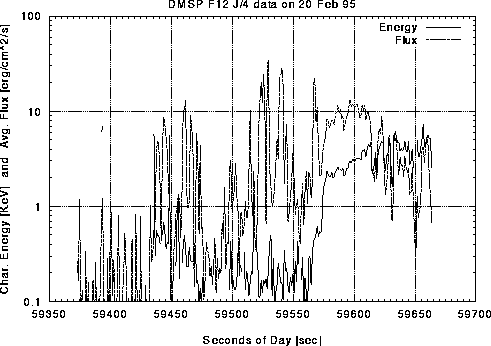
Figure 5.54: Average electron energy and flux determined from SSJ/4 instrument
measurements: 20 Feb/95
Figure 5.55 shows clearly that the region of high F-layer ionization corresponds exactly to the period in which double-peaked spectra were observed.
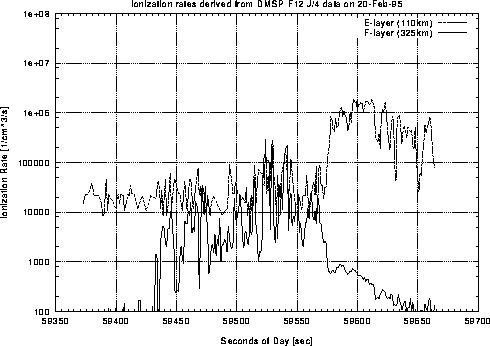
Figure 5.55: Estimated ionization rates at E- and F-layer heights determined from electron
spectra measurements: 20 Feb/95
Figure 5.56 indicates the beginning of high E-layer conductivity to be at
about ![]() matching exactly the beginning of missing Kapuskasing
backscatter.
matching exactly the beginning of missing Kapuskasing
backscatter.
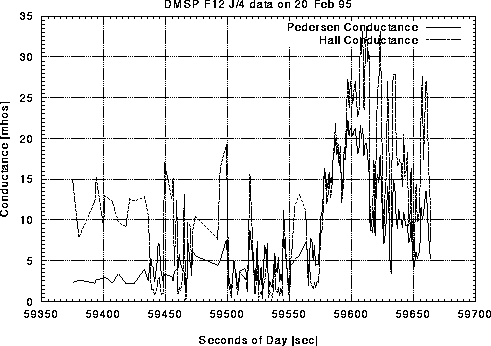
Figure 5.56: Estimated E-layer conductivities from the Robinson model: 20 Feb/95
The velocity map in Figure 5.57 shows that there is a
strong shear in the region of westward convection centered at about
![]() latitude, which is the center of the region of double peaked
spectra. Below
latitude, which is the center of the region of double peaked
spectra. Below ![]() N is a section of flow at very low velocities
which are in a westward direction further south. An interesting feature is
the presence of a large scale, morning sector convection vortex centered at about
N is a section of flow at very low velocities
which are in a westward direction further south. An interesting feature is
the presence of a large scale, morning sector convection vortex centered at about ![]() N and
N and
![]() E. The vortex has upward vorticity so the field-aligned current is
downward which is as expected, opposite to the upward FAC observed in
afternoon vortices (Bristow et al., 1995).
E. The vortex has upward vorticity so the field-aligned current is
downward which is as expected, opposite to the upward FAC observed in
afternoon vortices (Bristow et al., 1995).
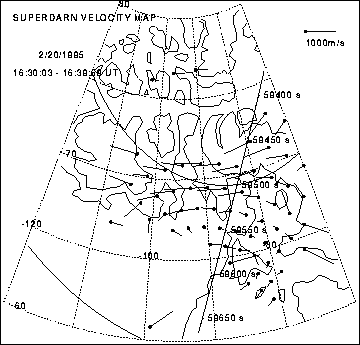
Figure 5.57: SuperDARN velocity map: 20 Feb/95