Again, solar wind speeds were steady at 360 km/s during the event. During
or after the event a change of the IMF ![]() and
and ![]() components from a
small positive to a negative value of 3 nT occurred as measured by WIND.
IMP8 recorded exactly the same pattern at 2:40 UT which therefore positions
this IMF change after the event. The
components from a
small positive to a negative value of 3 nT occurred as measured by WIND.
IMP8 recorded exactly the same pattern at 2:40 UT which therefore positions
this IMF change after the event. The ![]() index at the time of the
event was 1.0.
index at the time of the
event was 1.0.
Figure 5.58 shows a region of double-peaked spectra at low latitudes of
around ![]() N from
N from ![]() E to
E to ![]() E which the satellite passes
from
E which the satellite passes
from ![]() to
to ![]() . Isolated double-peak spectra are observed at
. Isolated double-peak spectra are observed at
![]() and
and ![]() as can be seen in Figure 5.59.
as can be seen in Figure 5.59.
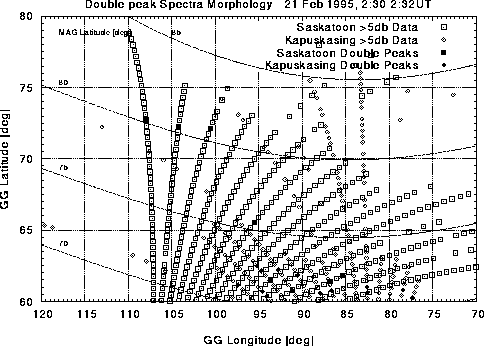
Figure 5.58: Map of spectral findings from the Saskatoon and Kapuskasing radars:
21 Feb/95
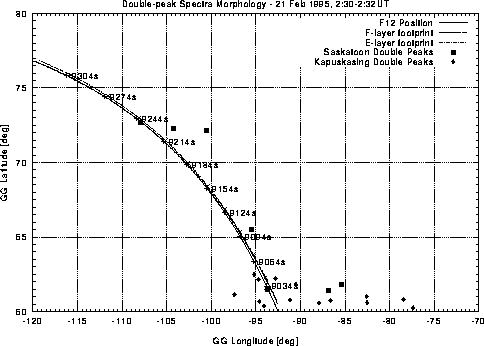
Figure 5.59: Peak-map with overlaid flight path of the DMSP F12 satellite: 21
Feb/95
The flux/energy graph in Figure 5.60 shows two regions of high
flux, one at electron energies of about ![]() from
from ![]() to
to ![]() and
one at lower electron energies from
and
one at lower electron energies from ![]() to
to ![]() .
.
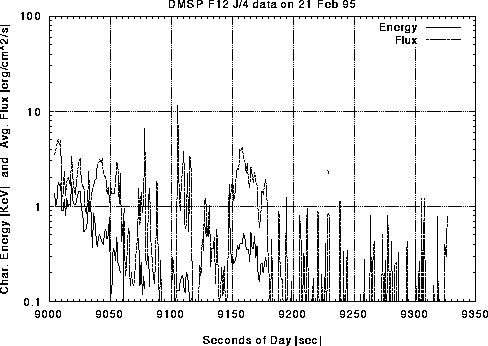
Figure 5.60: Average electron energy and flux determined from SSJ/4 instrument
measurements: 21 Feb/95
Contrary to the above segmentation into two precipitation regions,
Figure 5.61 shows that throughout the period from ![]() to
to ![]() the ionization rate in the F-layer is quite variable. Sharp gradients occur
at
the ionization rate in the F-layer is quite variable. Sharp gradients occur
at ![]() close to an observed double-peak spectrum. The sharp ionization
peak at
close to an observed double-peak spectrum. The sharp ionization
peak at ![]() is almost exacly coincident with the double peak event that
lies on the satellite track at
is almost exacly coincident with the double peak event that
lies on the satellite track at ![]() . This peak is only a few seconds in
width, corresponding to a spatial structure less than about 15 km across.
. This peak is only a few seconds in
width, corresponding to a spatial structure less than about 15 km across.
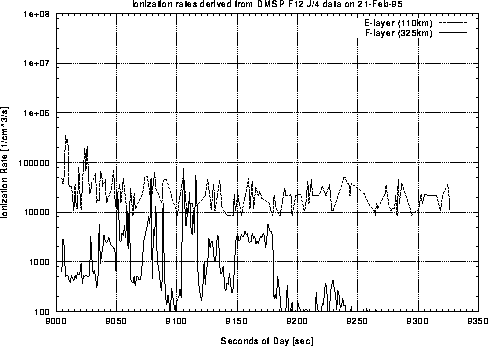
Figure 5.61: Estimated ionization rates at E- and F-layer heights determined from electron
spectra measurements: 21 Feb/95
Figure 5.62 indicates that E-layer conductivities are not much enhanced by the precipitation.
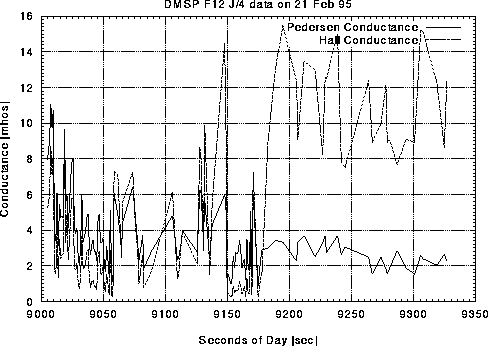
Figure 5.62: Estimated E-layer conductivities from the Robinson model: 21 Feb/95
Velocities in Figure 5.63 are very steady at around ![]() westward and have been recorded in the area of double-peak spectra occurrence.
The double-peak spectra thus are located in a region of eastward current,
which one would normally associate with the eastward auroral electrojet.
The low
westward and have been recorded in the area of double-peak spectra occurrence.
The double-peak spectra thus are located in a region of eastward current,
which one would normally associate with the eastward auroral electrojet.
The low ![]() and the positive
and the positive ![]() IMF conditions preceding
the event are not consistent with the low latitude of the current and the
scatter if the event were in the postnoon sector. However these results
occur near magnetic dusk where the influence of the near-midnight substorm
region is felt. The analysis of ionospheric velocity maps 30, 20 and 10 minutes
before the event indicate that the velocities doubled and an associated
velocity shear is built up in the north-south direction.
IMF conditions preceding
the event are not consistent with the low latitude of the current and the
scatter if the event were in the postnoon sector. However these results
occur near magnetic dusk where the influence of the near-midnight substorm
region is felt. The analysis of ionospheric velocity maps 30, 20 and 10 minutes
before the event indicate that the velocities doubled and an associated
velocity shear is built up in the north-south direction.
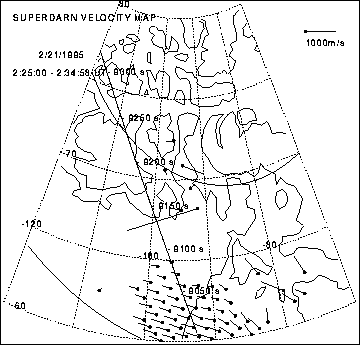
Figure 5.63: SuperDARN velocity map: 21 Feb/95