


Next: Conclusion and Summary
Up: SUPERDARN MEASUREMENTS OF DOUBLE-PEAKED
Previous: 25 Feb/951:42 -
The double-peaked Doppler-velocity spectra described previously
have been identified as a special feature of the F-layer during certain
ionospheric conditions. The following section will try
to summarize several possible mechanisms that can produce a double-peaked
Doppler-velocity spectrum.
These featured spectra co-locate approximately with the auroral oval and,
for some events near magnetic noon, the cusp.
Therefore conditions related to auroral and cusp particle
precipitation can contribute to the generation of these spectra.
Furthermore, a correlation with low-energy electron precipitation can be
observed; this form of electron precipitation produces a region of enhanced
ionization of the upper E- or lower F-layer. Thus, the spectra could be
linked to an increased ionization rate. A feature that was observed in the
region of the low-energy electron precipitation is the great spatial
inhomogeneity of the flux. It is also interesting to note here that
Grant et al. (1995) observed that, although SuperDARN and CADI
ionosonde data in general were in agreement, there was some disagreement
in the vicinity of spatial structures of strong
F-region ionization. Therefore, if strong ionization is a factor in
producing double-peaked Doppler-velocity spectra it could also be that the
greatest error using the SuperDARN phase-fit analysis technique occurs
because the method, which is very effective for single-peaked spectra, is
less effective for multiple peaked spectra .
Since most double peaked spectra events occurred during relatively quiet
magnetospheric conditions, magnetic substorms are probably not related
to the production of the spectral features. Nevertheless, these events are
frequently seen near magnetic local noon and could be related to dayside
aurora or the cusp/cleft region which is closely associated with
reconnection and the resulting plasma turbulence and FACs.
The analysis of the averaged plasma flow maps shows that
the spectral features occur regardless of the general flow direction and speed.
There is, however, evidence that a shear in flow is co-located with
double-peaked spectra.
In general, the spectrum of a single F-region scatterer consists
of one peak of Gaussian or Lorentzian shape [HVG  93].
If there are several scatterers in the field of view, signal-mixing
occurs and several peaks
corresponding to the distinct sources could be present in the spectrum.
Since the
scattering volume produced by the beam-forming and range-gating of the radar
has a modest spatial extent (approximately
  by
by  at a
at a  range) and the observation time is of the order
of seconds, it is possible that different Doppler velocities are
observed in the same volume. Nevertheless, the analysis in this thesis has
shown that the double-peaked spectra constitute only a small fraction (
  %) of the
total scatter. The bulk of the radar echoes exhibit single peaks even when
double-peaked regions appear in limited regions.
This fact is of course used in the current
SuperDARN data-processing scheme using the phase-fit method to determine the
mean Doppler velocity in the scattering region.
To generate a double-peak in the spectrum, a mechanism is needed that
will increase the Doppler velocity in one area of the scattering volume and
decrease it in another. The scale of the mechanism should be small enough
to fit into a single scattering volume observed by the radar.
It should also preserve the mean Doppler velocity of the bulk medium as the
average velocity maps do not show any anomalies when double-peaked spectra
are present. We can distinguish two classes of mechanisms that produce
double-peaked spectra: either there are two adjacent distinct regions of
different flow velocities (a region of velocity shear)
or there is a single structure with varying flow.
The first class of distinct regions could be observed when a gradient
drift instability is dominant. If a plasma enhancement is created through
ionization of the F-layer, the gradient drift instability will produce
density waves that travel away from the enhancement at a speed
 ,
where
  is the polarization electric field and the B the
magnetic field. The main problem with the gradient
drift instability is that
the observed speeds, which are of the order of hundreds of m/s, are too large to
be produced and maintained easily by the polarization electric fields as
they would be required to have the same order of magnitude
as the large scale electric fields.
Table 6.1 lists the mean velocity separation and
corresponding standard deviation from the mean for the events. The mean
separation of 254 m/s is well defined and comparable to the usual
 convection velocity component
measured by a single radar in the F-region.
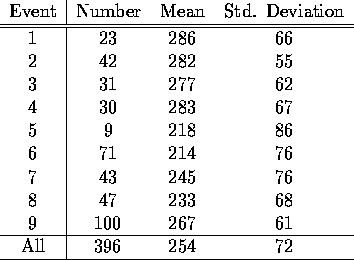
Table 6.1: Statistics of the double-peak spectra: number of spectra, mean
velocity separation and standard deviation from the mean
The second class of mechanisms occurs in a number of situations that are
similar in their velocity profiles. Doppler velocity spectral measurements
of the D-region have produced double-peaked spectral features which have
been attributed to gravity waves.
The motion of gravity waves through the field of view of the
radar beam produces a modulation pattern that generates a spectrum that is
broadened to two distinct peaks. Such a behavior has been described by
several authors [LT89, SGR  90, JCN91].
Traveling ionospheric disturbances modulate the
phase of received F-region HF signals, but produce only a median jitter
velocity of 0.4 m/s [JCN91, p. 71,] which is far less than the
observed velocity separation of most peaks (and of course the resolution
of the instrument). The main effect of gravity waves on SuperDARN data is the
quasi-periodic enhancement of ground-scatter [BGS94].
Another possibility that is more appropriate for the
SuperDARN geometry is the generation of a vortical flow pattern of the
plasma (and the embedded instabilities).
A vortical flow pattern generates a Doppler velocity
spectrum similar to that from gravity waves. In the ionosphere, one can
identify vortices at all scale sizes which means they are a common feature.
On a global scale, a consistent two-cell
convection pattern is observed that looks like twin-vortices (see for
example the recent and well known HM-model [HM87]).
Long-lived vortices in the plasma flow of the F-region
with a size of about 1000 km have been
observed with the SuperDARN radar and ground-based magnetometers and are
believed to be caused by the Kelvin-Helmholtz instability at the inner edge
of the low-latitude boundary layer [BSJ  95].
Traveling convection vortices (TCVs) are short-lived and
fast moving vortical plasma flow structures of 500-1000 km in size that have been
observed for several years and are believed have a significant effect on the
localized ionosphere [SZS94]. Vortices are frequently associated
with auroral observations [Dav92]. The pertubation of the geomagnetic
field by the field of a sheet current tends to warp the sheet into a vortex.
This process applies to the electron precipitation that causes auroral
emissions and creates a visible auroral spiral of 20-1500 km diameter.
A similar development caused by excess electric charge creates 2-10 km sized
auroral curls in which geomagnetic field lines remain mutually parallel.
A recent dynamic theory of auroral spirals included the effects of
field-aligned current in a velocity shear driven Kelvin-Helmholtz
instability model. The model produces vortices which are wound in a sense
consistent with spiral observations and that grow faster than predicted by the
simpler models [LS96].
Vortical flows can be produced by the Kelvin-Helmholtz
instability which in turn requires regions of velocity shear perpendicular
to the flow direction. Thus, if the Kelvin-Helmholtz instability is the
cause of vortical flow, there should be some correlation with
velocity shear. In several events a strong velocity shear can be observed in
the north-south direction where double-peaked spectra occur (16 Jan/95,
26 Jan/95, 20 Feb/95 and 21 Feb/95). This shear is expected from the
current reversal in the boundary layer as shown in Figure
6.1.
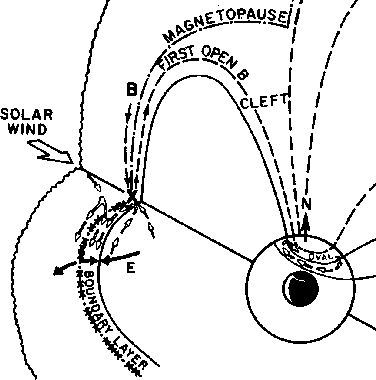
Figure 6.1: Three dimensional view of plasma convection in the equatorial plane
and in the ionosphere (from W. J. Heikkila)
The likely region of development of small-scale vortices by the Kelvin-Helmholtz
instability is the inner edge of the low latitude boundary layer [Lee84]
which would correspond to a ``Region 1'' (R1) field aligned current.
Figure 6.2 shows a macroscopic convection vortex on the morning
side that is associated with a R1 FAC. Double-peaked spectra were observed
within one degree in latitude from  N over a longitudinal range from
 E to
E to  E which corresponds to the region with a current
of
  .
.
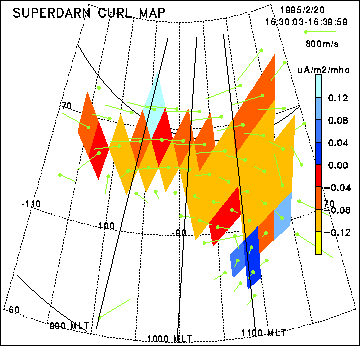
Figure 6.2: SuperDARN curl map for 20 Feb/95 showing strong R1-FAC and a large
scale vortex at about 10:00 magnetic local time
Another way of generating a vortical flow is the generation
of a column of charge. When comparing the flux of the low-energy regions
with the high-energy regions, one observes a striking difference in the
homogeneity of the flux. In the low-energy precipitation regions the flux is
very variable, changing up to two orders of magnitude over distances of less
than  . This suggests a ray-like auroral structure elongated along
field lines. Figure 6.3 shows a possible
configuration for such a charged column. A negative charge density enhancement, assuming a
cylindrical structure, produces an electric field that is directed radially
inward and drives a circular
  flow.
flow.
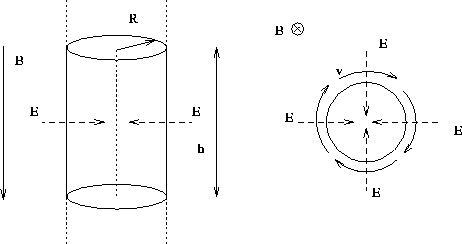
Figure 6.3: Geometry in a cylindrical density enhancement (left) that produces a
vortical flow (right)
The velocity of the vortical flow speed in such a case is related to the
electron density enhancement as follows. We apply Gauss' law to a segment
of the tube of enhanced electron density with radius R and length l
(see Figure 6.3 - left).

If the electron density  is assumed to be uniform within the tube,
equation 6.1 reduces to

so

If the tube is field aligned, the velocity of the vortical flow v (see
Figure 6.3 - right) is given by v = E/B and
perpendicular to the electric field. The density enhancement is then

and can be calculated from the measured peak separation which is assumed to
be equal to twice the velocity of the radial flow.
Similarly, one can derive Equation 6.4 from Gauss' Law

and the induced field

Combining these two equations gives

If we expand the dot product and make use of the fact that the curl of  is related to the FAC
  we can write

Applying the charge column geometry to the cross product in the first term and
removing the second term which is close to zero due to the dot product, we
will again arrive at the same result of Equation 6.4.

For the average peak separation velocity of  (see table
6.1) and a tube radius of
  at
F-layer heights, the resulting electron density enhancement is
of the order of
  or a number density of
  for the excess electrons.
Another structure that can produce a double peaked spectrum
is an arc or band of plasma with enhanced electron density. The
arc would produce an electric field that points towards the center of
the arc, causing an  drift in opposite directions on either
side of the arc as indicated in Figure 6.4. The detectability
of such a structure with the radar will depend on the angle the radar
beam makes with the arc. It is best detected when the beam is along the
arc. If however the beam is directed approximately perpendicular to the arc,
there will only be a small component of the pertubation velocity that can be
measured and the spectrum of the arc structure should remain invisible
to the radar. This property of the arc structure can therefore explain
some of the observations for which double peaked spectra are visible with
one radar but not the other.
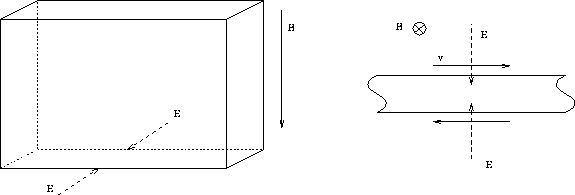
Figure 6.4: Geometry in a arc-shaped density enhancement (left) that produces a
flow in opposite directions on either side of the arc (right)
Kintner and Seyler note that the Kelvin-Helmholtz instability is a common
feature of magnetized electron beam sheets in laboratory plasmas [KS85, p. 107,].
This fluid instability is produced by a small excess of
electrons within the beam which in turn generates an electric field. The
resulting  drift results in a velocity shear across the electron
beam which is unstable and produces vortex-like structures which are about
 in size. The beams are associated with electrostatic shocks that are
characterized by perpendicular electric fields which are of the order of
 between the ionosphere and the magnetosphere (2000-8000 km).
Burke et al. [BSH83] have observed auroral vortices
with the S3-2 satellite . If the electric and magnetic
fields are measured simultaneously along the approximately  height
flight path of
the S3-2 satellite, auroral vortices
can be detected from their distinct electric field signature. They
concluded that the vortices observed had a scale size of
  and
resulted from unstable auroral charge sheets with electric fields that
exceeded
  .
.
Johnson et al. [JC95] have observed large,
radially divergent, vortex-like electric fields with the FREJA satellite .
They found agreement
between the observations and a model which treated large amplitude vortex
solutions travelling in the E-W direction along a density depletion. The
spatial scale of these structures was of the order of  and the
associated electric fields were large (up to
  ).
).
McDiarmid [MYGA94] has observed traveling vortex structures
with the GOES 7 satellite and a related field line resonance.
Doppler velocity spectra of model vortices have been calculated
numerically by Zrnic and Doviak [ZD75] for the
case of tornadoes, scanned with a pulsed Doppler radar. The model showed
that bimodal spectra should be produced, both for very narrow and very broad
antenna beamwidths and that the spectra should exhibit a rapid power
decrease for spectral components near the maximum velocity. These predictions
agreed very well with actual radar observations.


Next: Conclusion and Summary
Up: SUPERDARN MEASUREMENTS OF DOUBLE-PEAKED
Previous: 25 Feb/951:42 -
Andreas Schiffler
Wed Oct 9 10:05:17 CST 1996
 .
Since most double peaked spectra events occurred during relatively quiet
magnetospheric conditions, magnetic substorms are probably not related
to the production of the spectral features. Nevertheless, these events are
frequently seen near magnetic local noon and could be related to dayside
aurora or the cusp/cleft region which is closely associated with
reconnection and the resulting plasma turbulence and FACs.
The analysis of the averaged plasma flow maps shows that
the spectral features occur regardless of the general flow direction and speed.
There is, however, evidence that a shear in flow is co-located with
double-peaked spectra.


